
Diagnostic classification
models
A brief introduction
Conceptual foundations

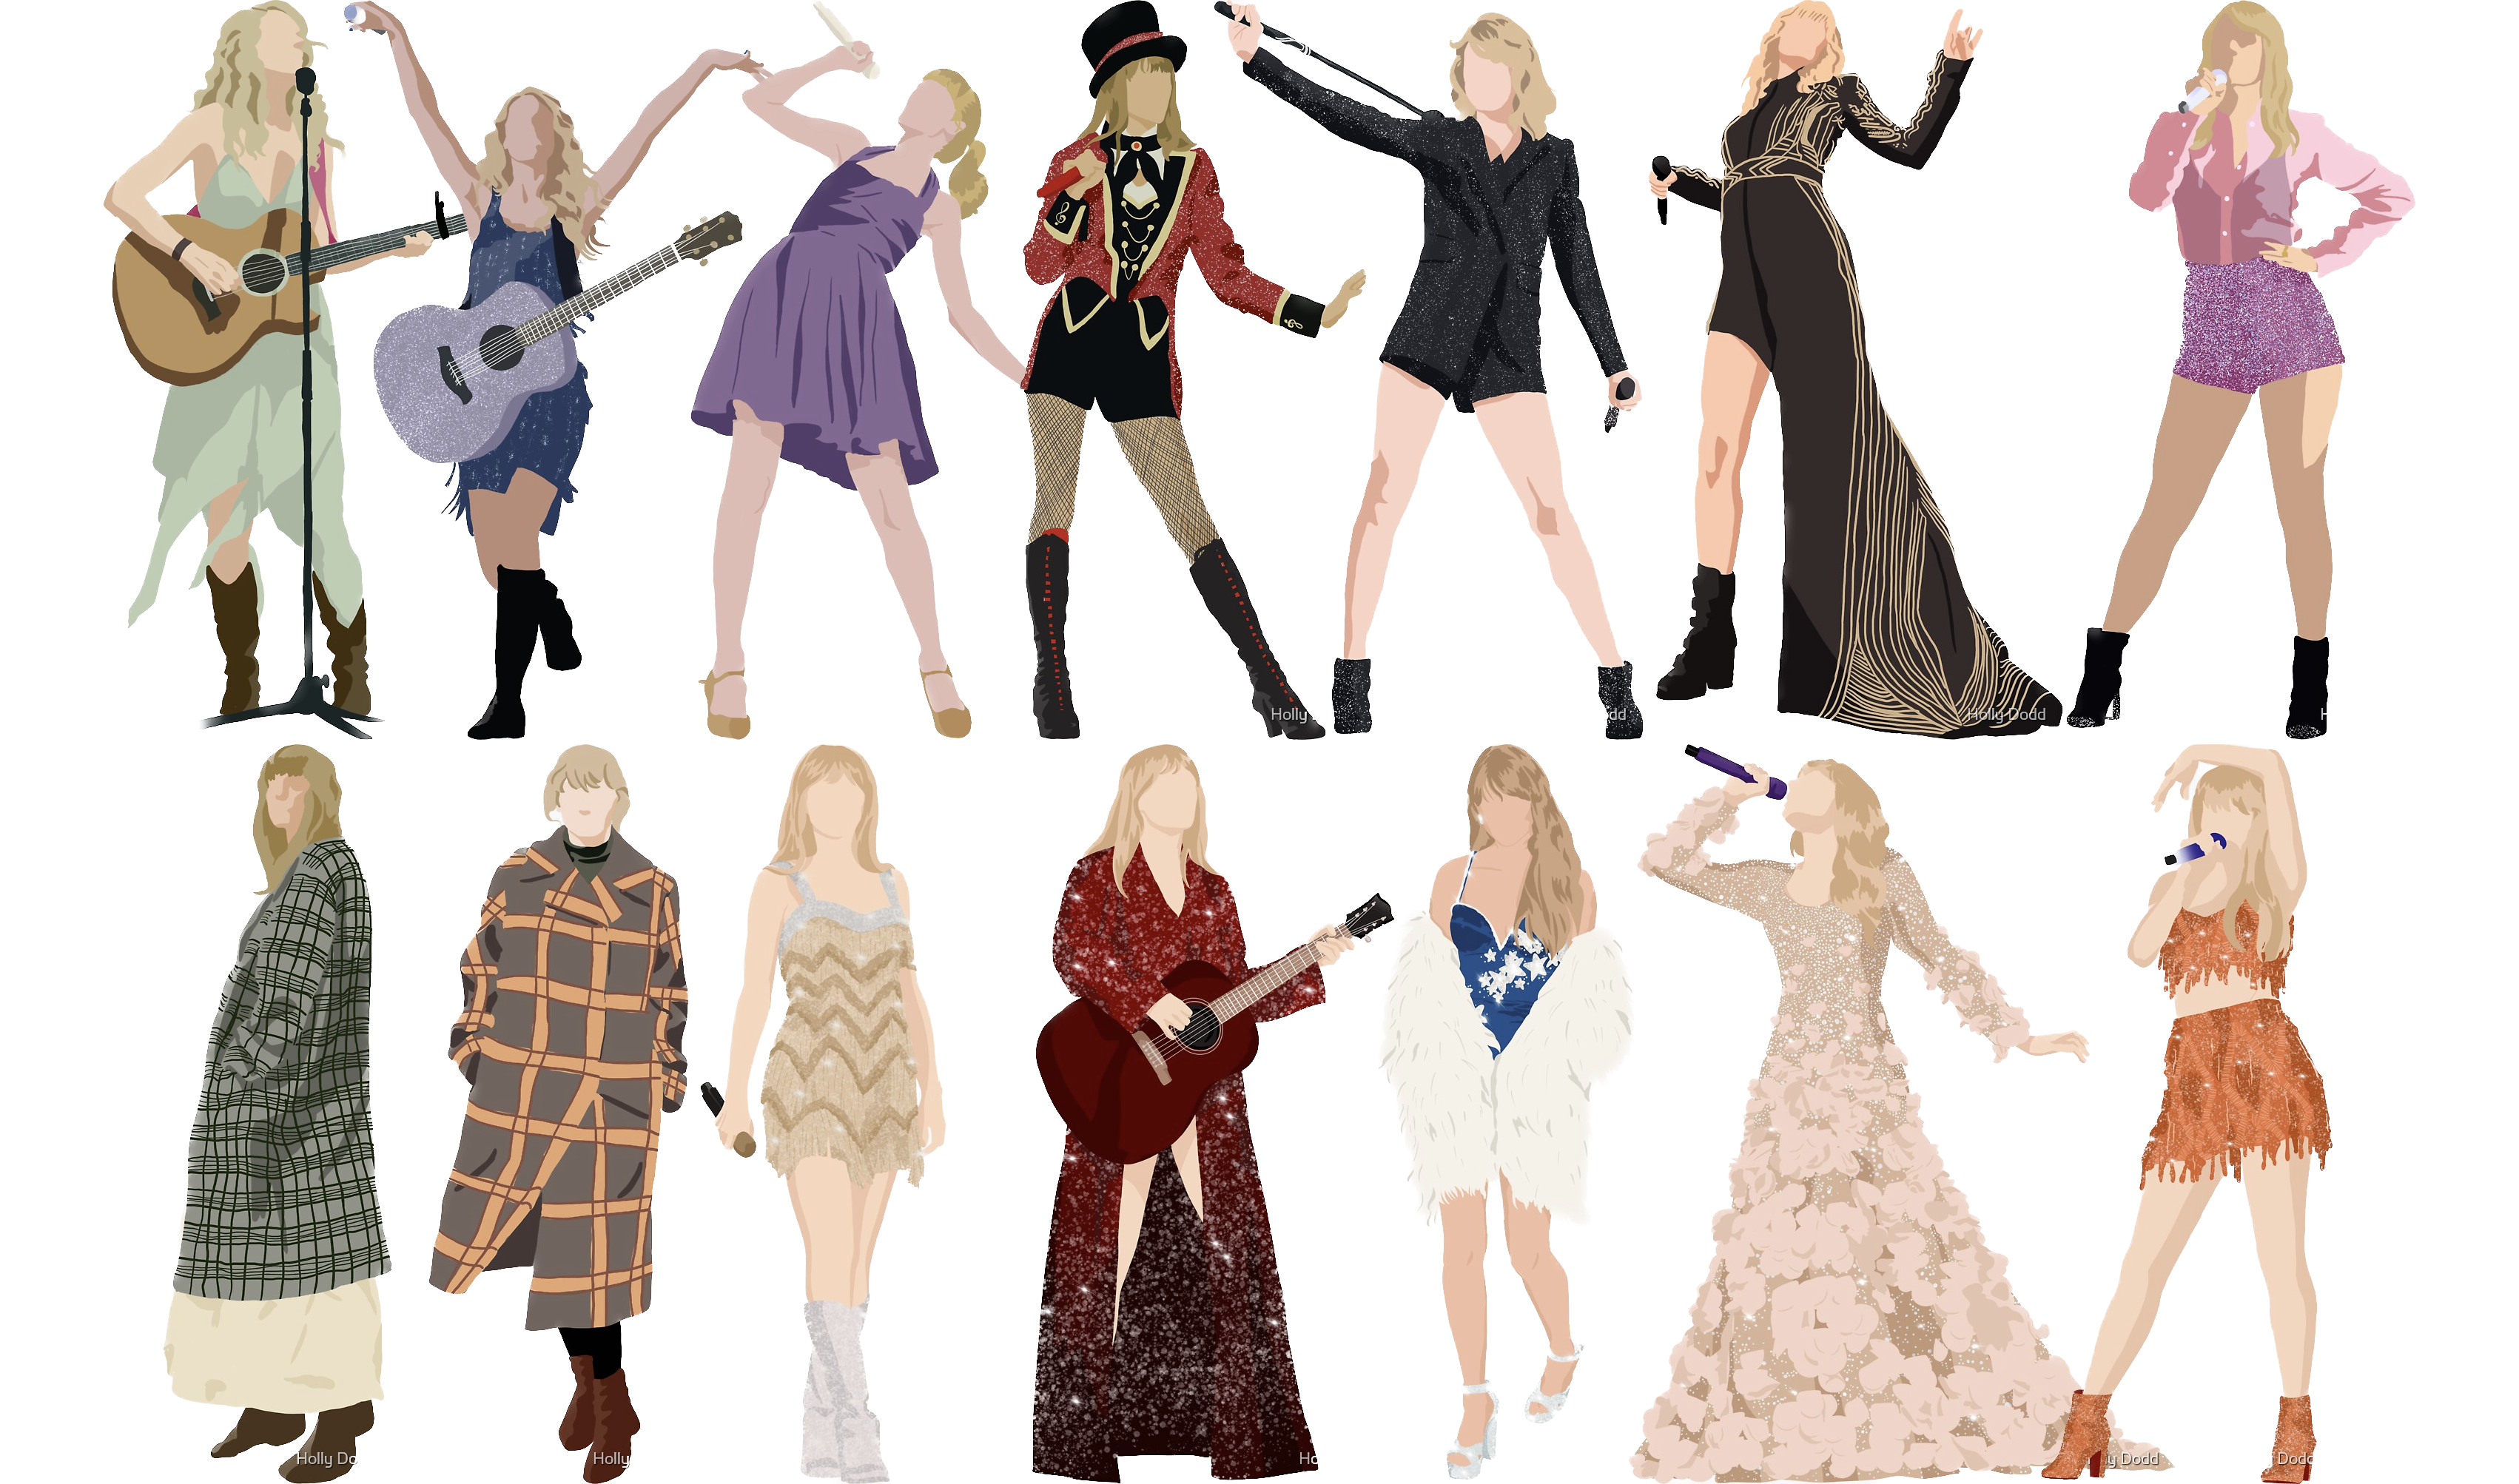
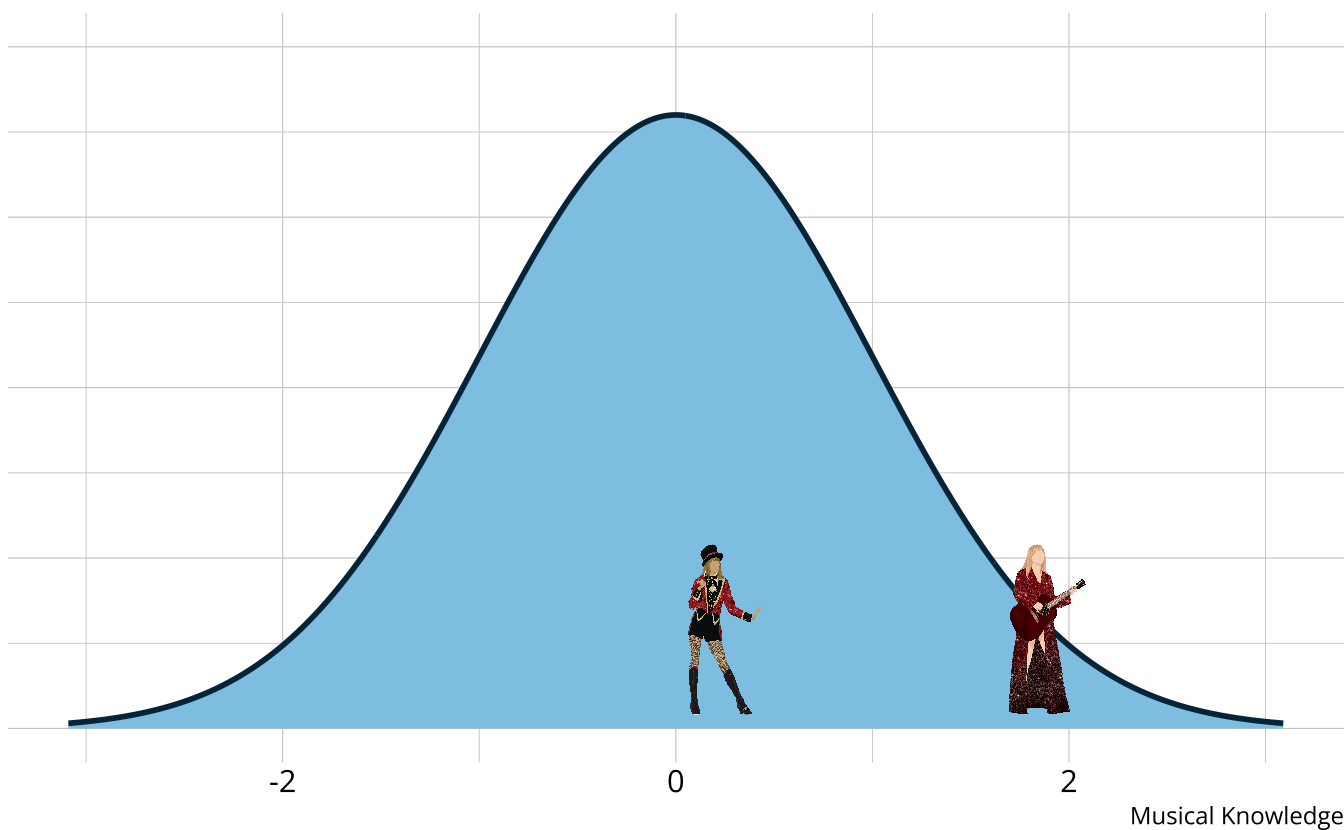
- Traditional assessments and psychometric models measure an overall skill or ability
- Assume a continuous latent trait
Traditional methods
- The output is a weak ordering of albums due to error in estimates
- Confident Taylor Swift (debut) is the worst
- Not confident on ordering toward the middle of the distribution
- Limited in the types of questions that can be answered.
- Why is Taylor Swift (debut) so low?
- What aspects do each album demonstrate proficiency or competency of?
- How much skill is “enough” to be competent?
Music example
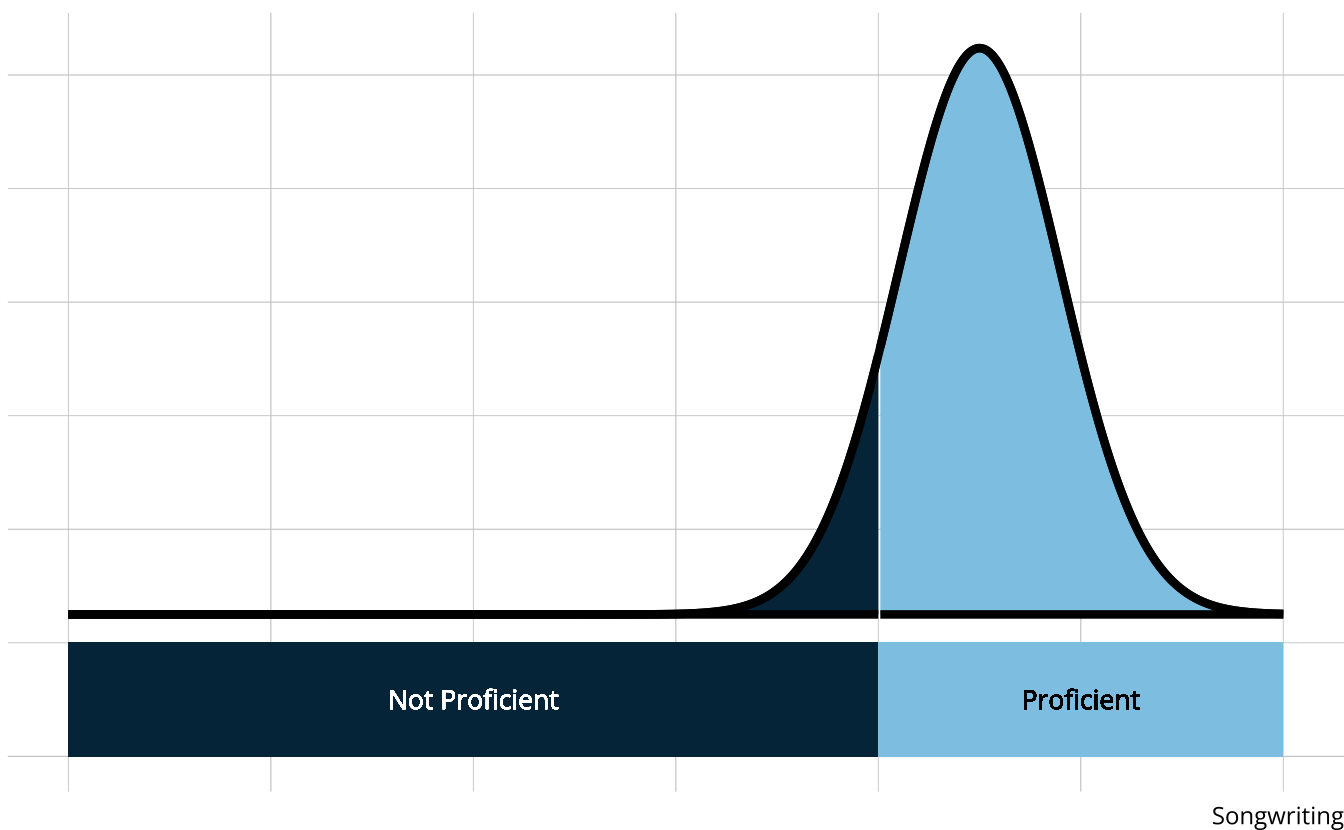
- Rather than measuring overall musical knowledge, we can break music down into set of skills or attributes
- Songwriting
- Production
- Vocals

- Attributes are categorical, often dichotomous (e.g., proficient vs. non-proficient)
Diagnostic classification models
- DCMs place individuals into groups according to proficiency of multiple attributes
| songwriting | production | vocals | |
|---|---|---|---|
Answering more questions
- Why is Taylor Swift (debut) so low?
- Subpar songwriting, production, and vocals
- What aspects are albums competent/proficient in?
- DCMs provide classifications directly
Diagnostic psychometrics
- Designed to be multidimensional
- No continuum of student achievement
- Categorical constructs
- Usually binary (e.g., master/nonmaster, proficient/not proficient)
- Several different names in the literature
- Diagnostic classification models (DCMs)
- Cognitive diagnostic models (CDMs)
- Skills assessment models
- Latent response models
- Restricted latent class models
Benefits of DCMs
- Fine-grained, multidimensional results
- Incorporates complex item structures
- High reliability with fewer items
Results from DCM-based assessments
| songwriting | production | vocals | |
|---|---|---|---|
- No scale, no overall “ability”
- Students are probabilistically placed into classes
- Classes are represented by skill profiles
- Feedback on specific skills as defined by the cognitive theory and test design
Fine-grained feedback
- Distinguish between respondents who may have similar scale scores
| songwriting | production | vocals | |
|---|---|---|---|
Item structures for DCMs
Item structure: Which skills are measured by each item?
- Simple structure: Item measures a single skill
- Complex structure: Item measures 2+ skills
Defined by Q-matrix
Interactions between attributes when an item measures multiple skills driven by cognitive theory and/or empirical evidence
- Can proficiency of one skill compensate for non-proficiency of another?
- Are skill acquired in a particular order (e.g., hierarchy)?
| item | songwriting | production | vocals |
|---|---|---|---|
| 1 | 1 | 0 | 0 |
| 2 | 0 | 0 | 1 |
| 3 | 0 | 1 | 0 |
| 4 | 1 | 1 | 0 |
| 5 | 1 | 0 | 1 |
| 6 | 0 | 1 | 0 |
| 7 | 0 | 1 | 0 |
| 8 | 1 | 0 | 1 |
| 9 | 0 | 0 | 1 |
| 10 | 1 | 0 | 1 |
| 11 | 1 | 1 | 0 |
| 12 | 0 | 1 | 1 |
| 13 | 0 | 0 | 1 |
| 14 | 1 | 0 | 1 |
| 15 | 1 | 1 | 0 |
| 16 | 0 | 1 | 0 |
| 17 | 1 | 0 | 0 |
| 18 | 1 | 1 | 0 |
| 19 | 1 | 0 | 0 |
| 20 | 1 | 0 | 1 |
| 21 | 0 | 0 | 1 |
Classification reliability
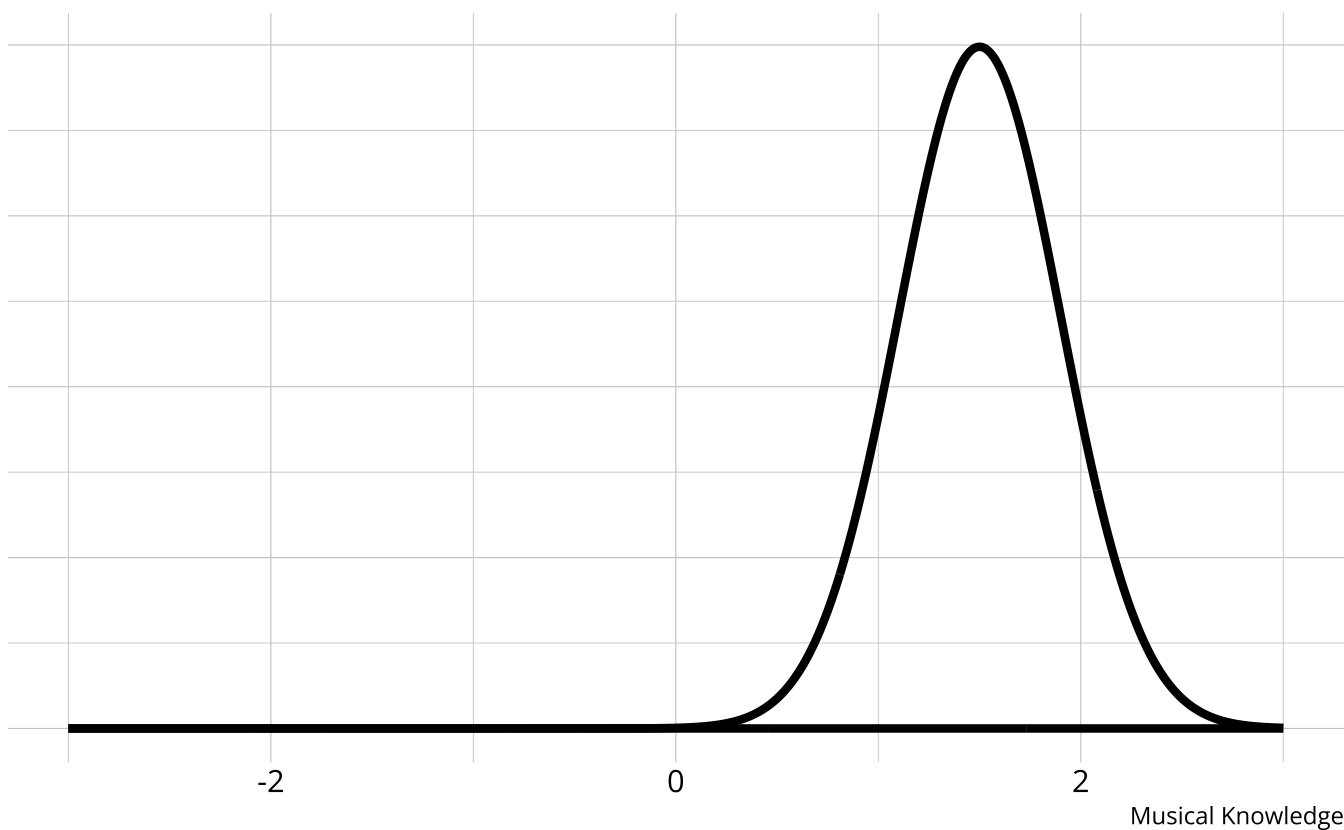
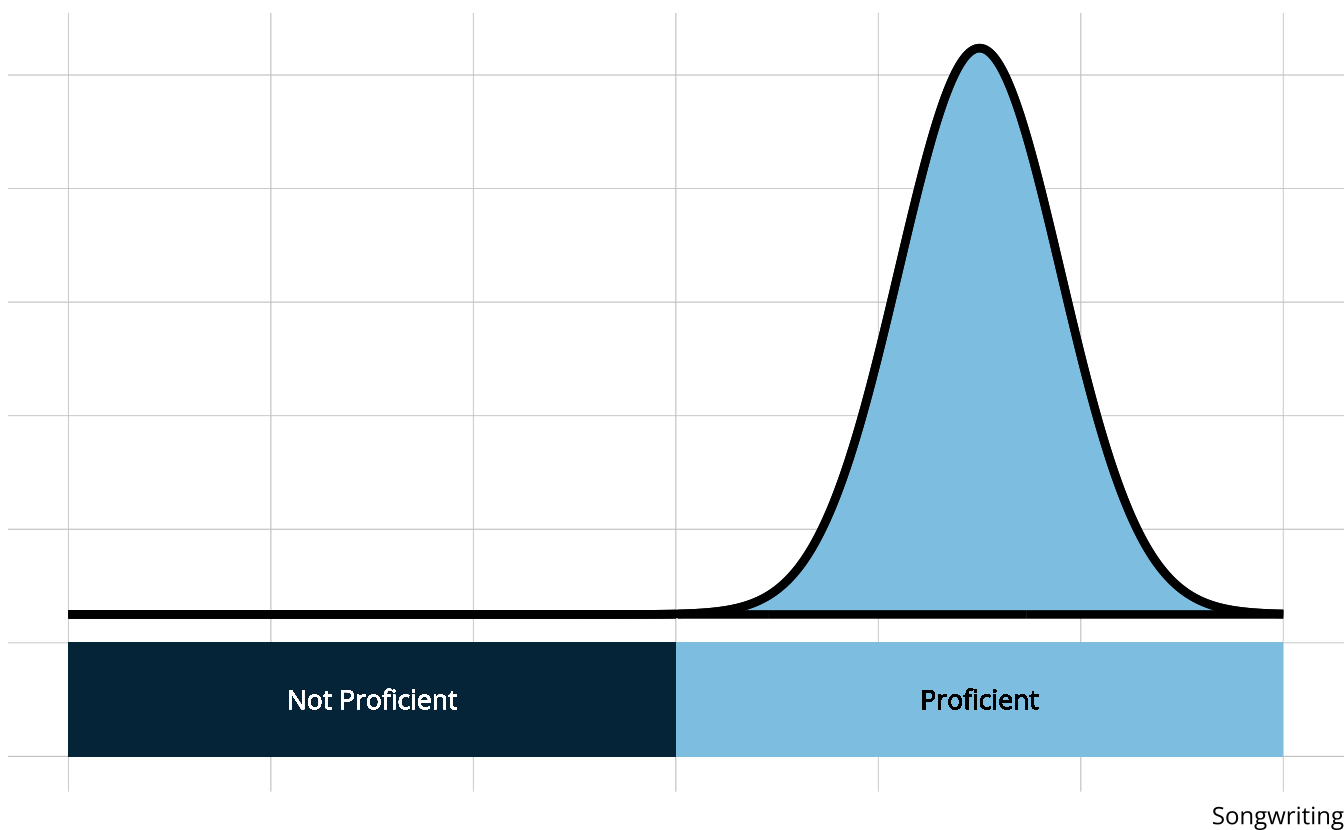
- Easier to categorize than place along a continuum
- Can set a proficiency threshold to optimize Type 1 or Type 2 errors
When are DCMs appropriate?
Success depends on:
- Domain definitions
- What are the attributes we’re trying to measure?
- Are the attributes measurable (e.g., with assessment items)?
- Alignment of purpose between assessment and model
- Is classification the purpose?
Example applications
- Educational measurement: The competencies that student is or is not proficient in
- Latent knowledge, skills, or understandings
- Used for tailored instruction and remediation
- Psychiatric assessment: The DSM criteria that an individual meets
- Broader diagnosis of a disorder
When are DCMs not appropriate?
When the goal is to place individuals on a scale
DCMs do not distinguish within classes
| songwriting | production | vocals | |
|---|---|---|---|
Conceptual foundation summary
- DCMs are psychometric models designed to classify
- We can define our attributes in any way that we choose
- Items depend on the attribute definitions
- Classifications are probabilistic
- Takes fewer items to classify than to rank/scale
- DCMs provide valuable information with more feasible data demands than other psychometric models
- Higher reliability than IRT/MIRT models
- Naturally accommodates multidimensionality
- Complex item structures possible
- Criterion-referenced interpretations
- Alignment of assessment goals and psychometric model
Statistical foundations
Statistical foundation
Latent class models use responses to probabilistically place individuals into latent classes
DCMs are confirmatory latent class models
- Latent classes specified a priori as attribute profiles
- Q-matrix specifies item-attribute structure
- Person parameters are attribute proficiency probabilities
Terminology
Respondents (r): The individuals from whom behavioral data are collected
- For today, this is dichotomous assessment item responses
- Not limited to only item responses in practice
Items (i): Assessment questions used to classify/diagnose respondents
Attributes (a): Unobserved latent categorical characteristics underlying the behaviors (i.e., diagnostic status)
- Latent variables
Diagnostic Assessment: The method used to elicit behavioral data
Attribute profiles
With binary attributes, there are 2A possible profiles
Example 3-attribute assessment:
[0, 0, 0]
[1, 0, 0]
[0, 1, 0]
[0, 0, 1]
[1, 1, 0]
[1, 0, 1]
[0, 1, 1]
[1, 1, 1]
DCMs as latent class models
\[ \color{#D55E00}{P(X_r=x_r)} = \sum_{c=1}^C\color{#009E73}{\nu_c} \prod_{i=1}^I\color{#56B4E9}{\pi_{ic}^{x_{ir}}(1-\pi_{ic})^{1 - x_{ir}}} \]
Structural models
\[ \color{#D55E00}{P(X_r=x_r)} = \sum_{c=1}^C\color{#009E73}{\nu_c} \prod_{i=1}^I\color{#56B4E9}{\pi_{ic}^{x_{ir}}(1-\pi_{ic})^{1 - x_{ir}}} \]
Structural component: Proportion of examinees in each class- Prevalence of each class in the population
- ν1 + ν2 + … + νc = 1
- Typically unconstrained
- Independent attributes (Lee, 2017)
- Log-linear structural models (Rupp et al., 2010)
Measurement models
\[ \color{#D55E00}{P(X_r=x_r)} = \sum_{c=1}^C\color{#009E73}{\nu_c} \prod_{i=1}^I\color{#56B4E9}{\pi_{ic}^{x_{ir}}(1-\pi_{ic})^{1 - x_{ir}}} \]
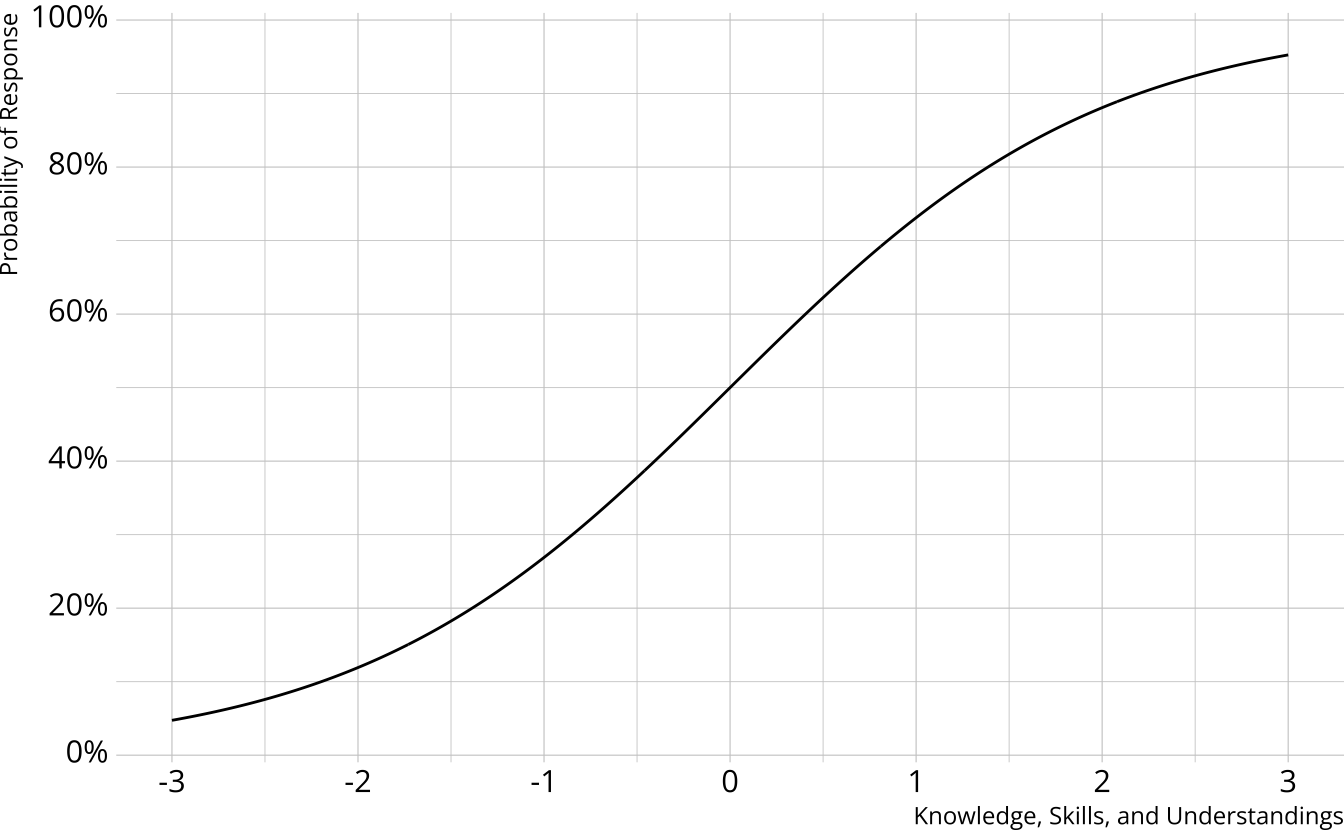
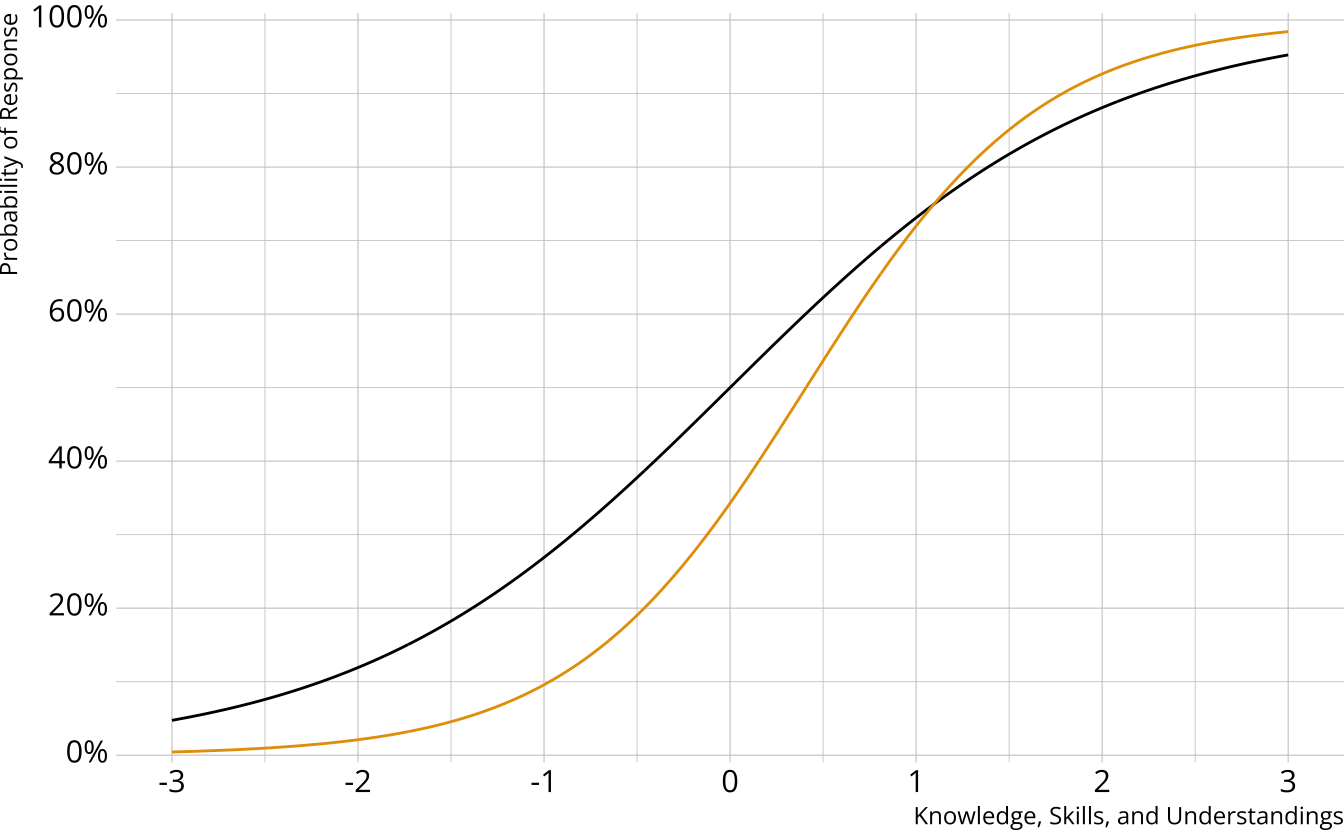
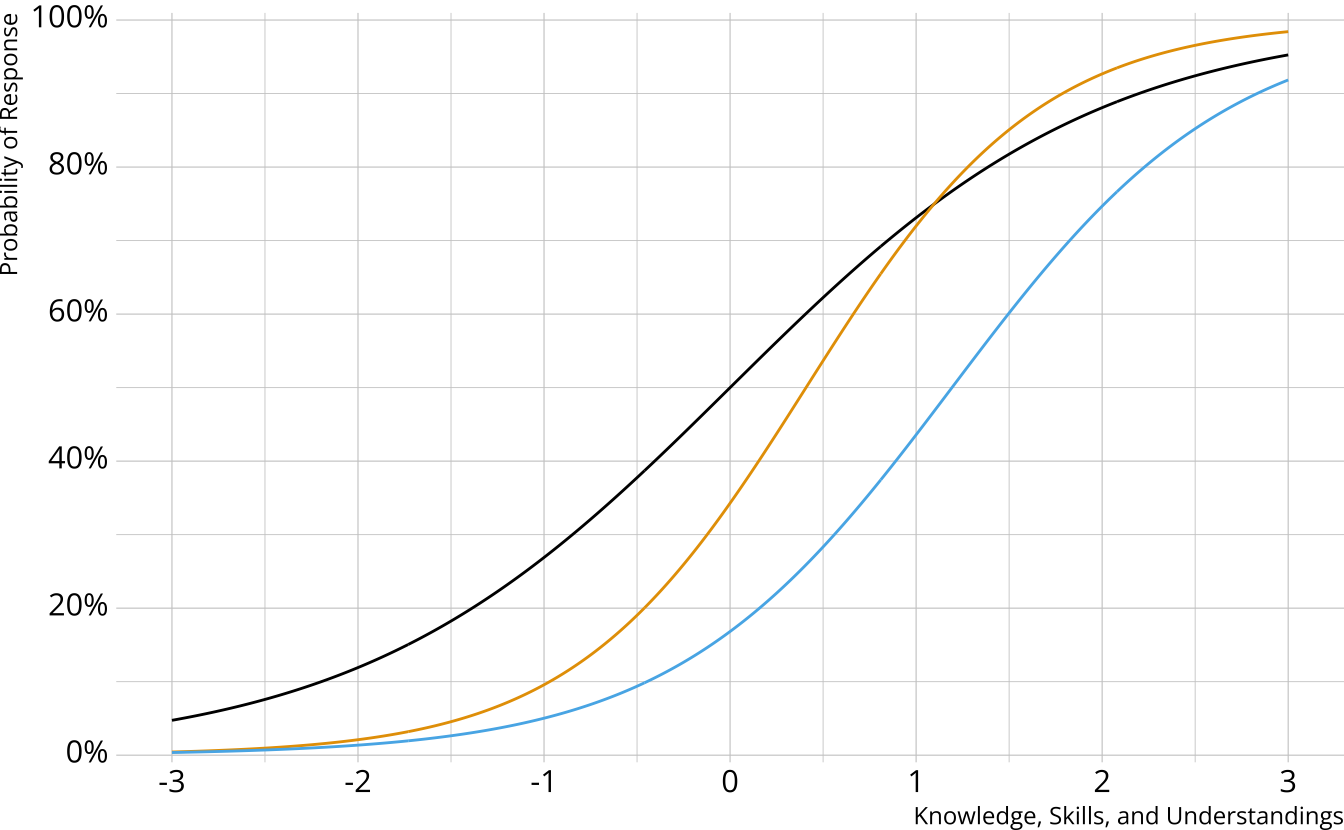
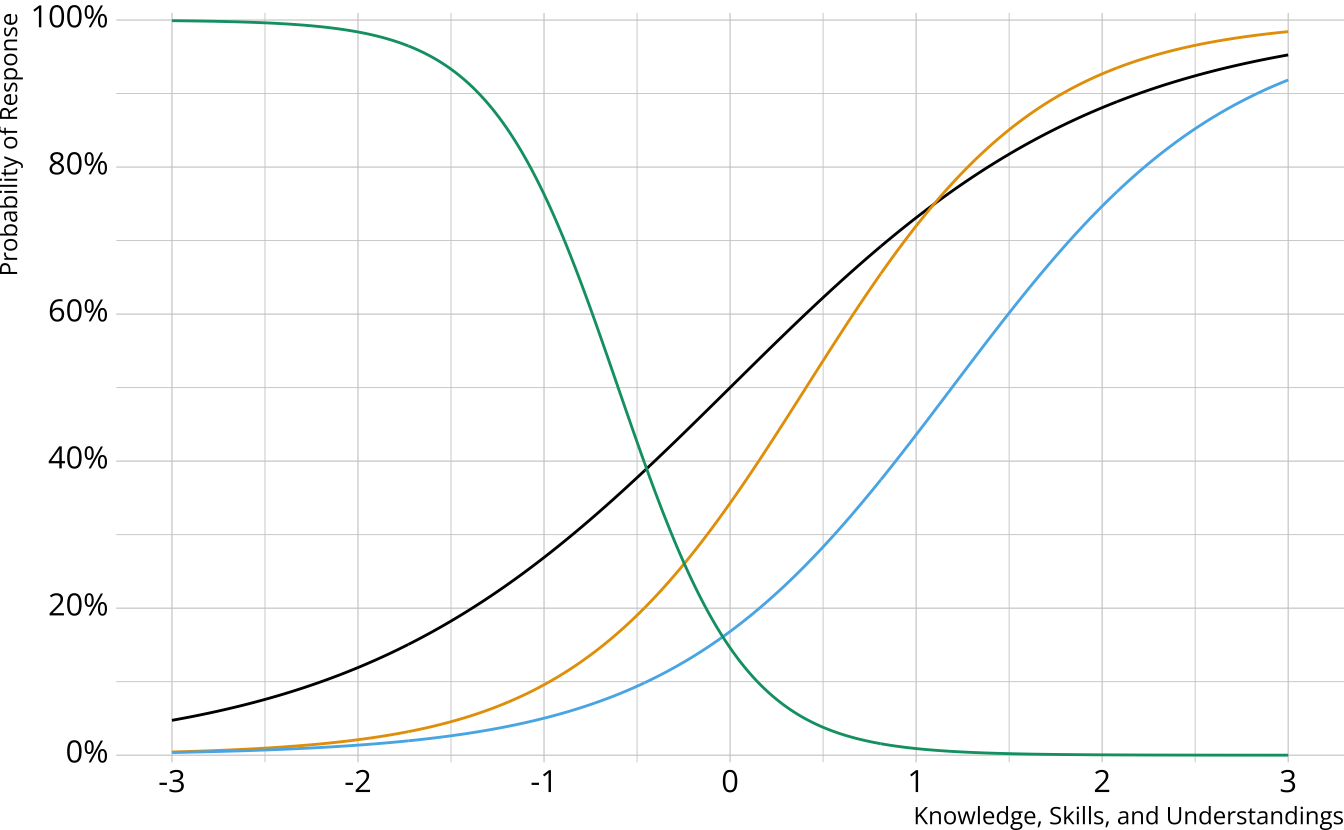
Measurement component: Product of item response probabilities- Traditional psychometrics: Item response theory, classical test theory
- A single, unidimensional construct
- Student results estimated on a continuum
- Performance on individual items determined by an “item characteristic curve”
- DCMs: Many different options
Diagnostic assessment items
Can be multidimensional
No continuum of student achievement
Categorical constructs
- Usually binary (e.g., master/nonmaster, proficient/not proficient)
DCM measurement models
Items can measure one or both attributes
Different DCMs define πic in different ways
- Each DCM makes different assumptions about how attributes proficiencies combine/interact to produce an item response
Item characteristic bar charts
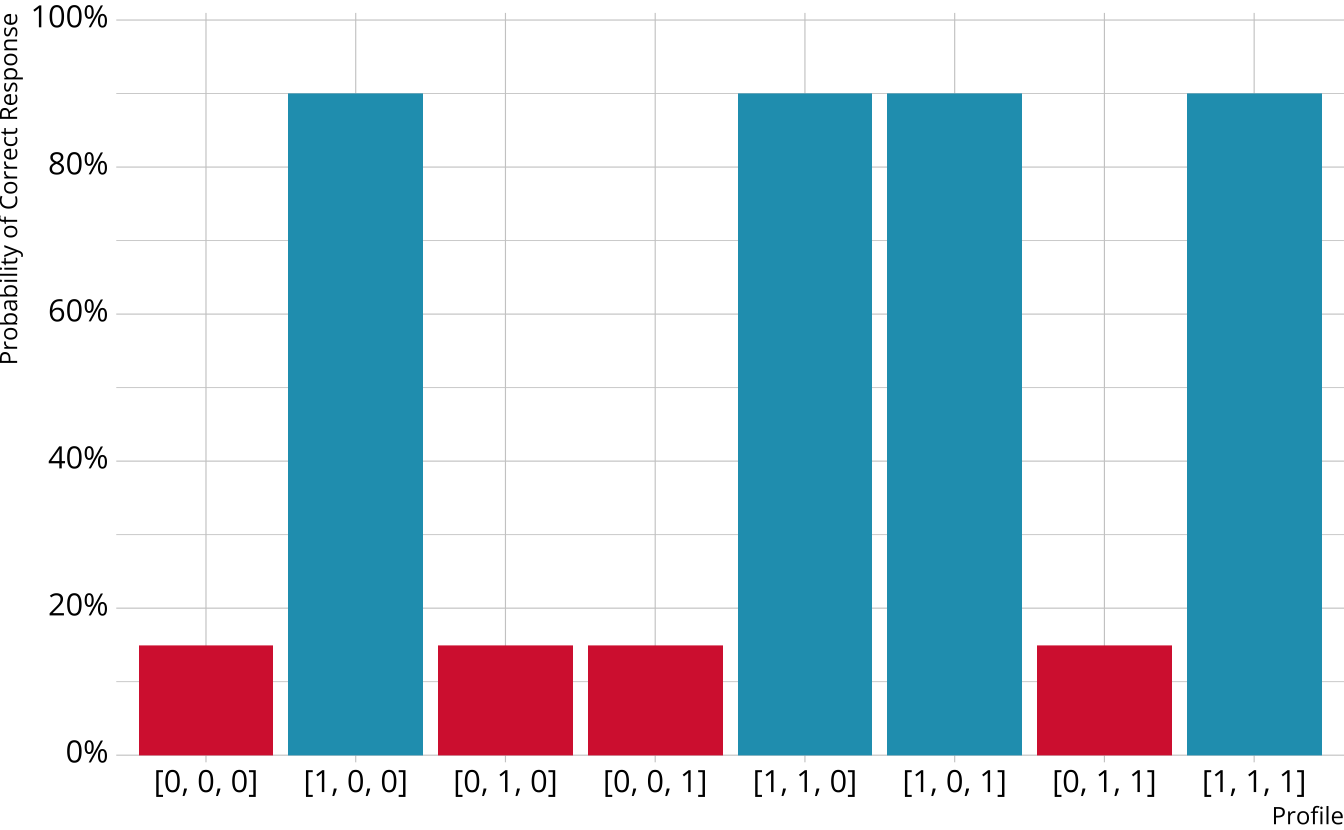
Single-attribute DCM item
Item measures just attribute 1
Respondents who are proficient on attribute 1 have high probability of correct response, regardless of other attributes
Multi-attribute items
When items measure multiple attributes, what level of mastery is needed in order to provide a correct response?
Many different types of DCMs that define this probability differently
- Compensatory (e.g., DINO)
- Noncompensatory (e.g., DINA)
- Partially compensatory (e.g., C-RUM)
General diagnostic models (e.g., LCDM)
Each DCM makes different assumptions about how attributes proficiencies combine/interact to produce an item response
Compensatory DCMs
Item measures attributes 1 and 2
Must be proficient in at least 1 attribute measured by the item to provide a correct response
Deterministic inputs, noisy “or” gate (DINO; Templin & Henson, 2006)

Non-compensatory DCMs
Item measures attributes 1 and 2
Must be proficient in all attributes measured by the item to provide a correct response
Deterministic inputs, noisy “and” gate (DINA; de la Torre & Douglas, 2004)

Partially Compensatory DCMs
Separate increases for each acquired attribute
Compensatory reparameterized unified model (C-RUM; Hartz, 2002)

Which DCM to use?
DINO, DINA, and C-RUM are just 3 of the MANY models that are available
Each model comes with its own set of restrictions, and we typically have to specify a single model that is used for all items (software constraint)
General form diagnostic models
- Flexible; can subsume other more restrictive models
- Again, several possibilities (e.g., G-DINA, GDM, LCDM)
General DCMs
Different response probabilities for each class (partially compensatory)
Log-linear cognitive diagnostic model (LCDM; Henson et al., 2009)
This will be our focus

Simple structure LCDM
Item measures only 1 attribute
\[ \text{logit}(X_i = 1) = \color{#D7263D}{\lambda_{i,0}} + \color{#219EBC}{\lambda_{i,1(1)}}\color{#009E73}{\alpha} \]
Subscript notation
- i = The item to which the parameter belongs
- e = The level of the effect
- 0 = intercept
- 1 = main effect
- 2 = two-way interaction
- 3 = three-way interaction
- Etc.
- (α1,…) = The attributes to which the effect applies
- The same number of attributes as listed in subscript 2
Complex structure LCDM
Item measures multiple attributes
\[ \text{logit}(X_i = 1) = \color{#D7263D}{\lambda_{i,0}} + \color{#4B3F72}{\lambda_{i,1(1)}\alpha_1} + \color{#9589BE}{\lambda_{i,1(2)}\alpha_2} + \color{#219EBC}{\lambda_{i,2(1,2)}\alpha_1\alpha_2} \]
Defining DCM structures
Attribute and item relationships are defined in the Q-matrix
Q-matrix
- I \(\times\) A matrix
- 0 = Attribute is not measured by the item
- 1 = Attribute is measured by the item
The LCDM as a general DCM
So called “general” DCM because the LCDM subsumes other DCMs
Constraints on item parameters make LCDM equivalent to other DCMs (e.g., DINA and DINO)
- DINA
- Only the intercept and highest-order interaction are non-0
- DINO
- All main effects are equal
- All two-way interactions are -1 \(\times\) main effect
- All three-way interactions are -1 \(\times\) two-way interaction (i.e., equal to main effects)
- Etc.
- C-RUM
- Only the intercept and main effects are non-0 (i.e., interactions are not estimated)
- Interactive Shiny app: https://atlas-aai.shinyapps.io/dcm-probs/
- DINA
From model parameters to respondents
Respondent estimates come from combining the estimated model parameters with the response data
For DCMs, a similar process to that for IRT
IRT respondent estimate
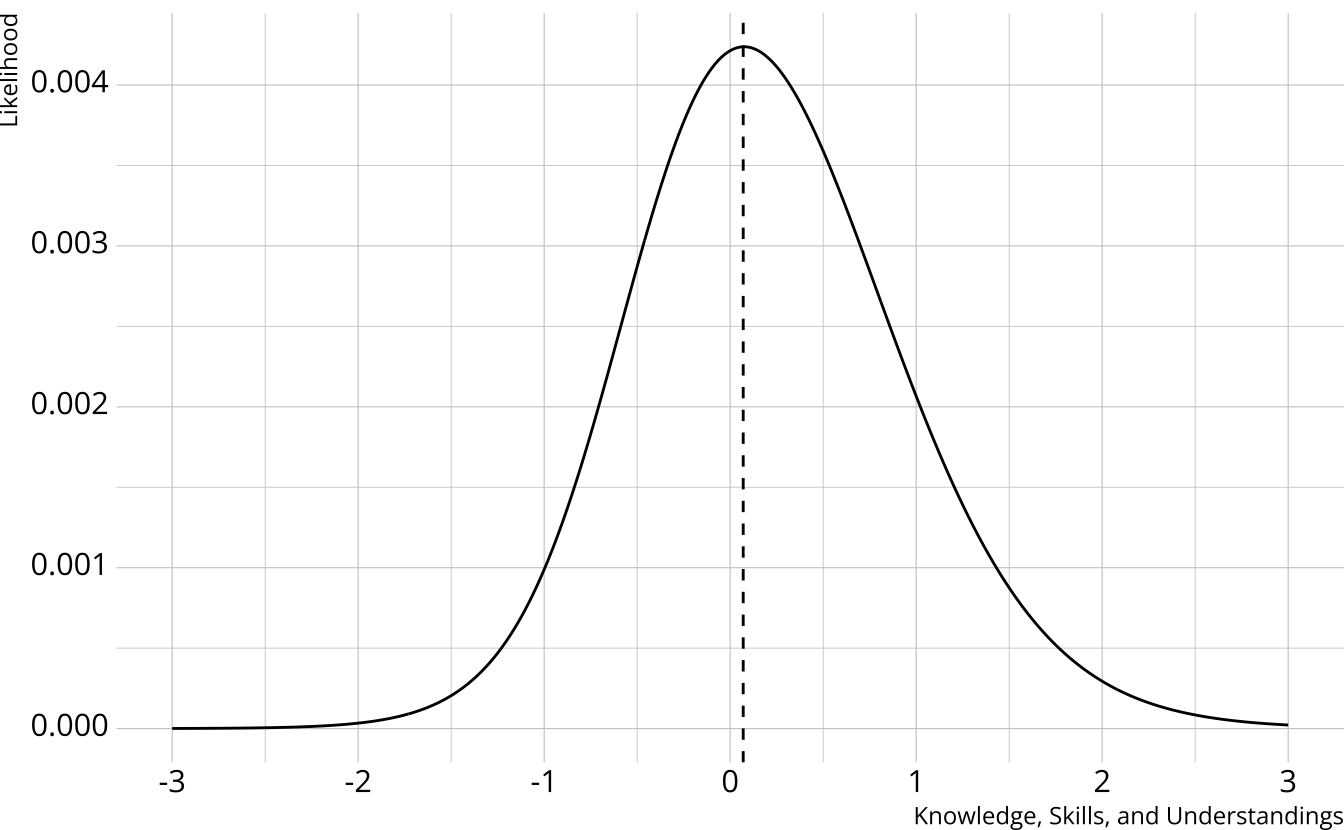
Multiply the ICCs together
- Multiply the response probabilities together for each value of the trait
Student estimate is the peak of the curve
Spread of the curve represents uncertainty in estimate

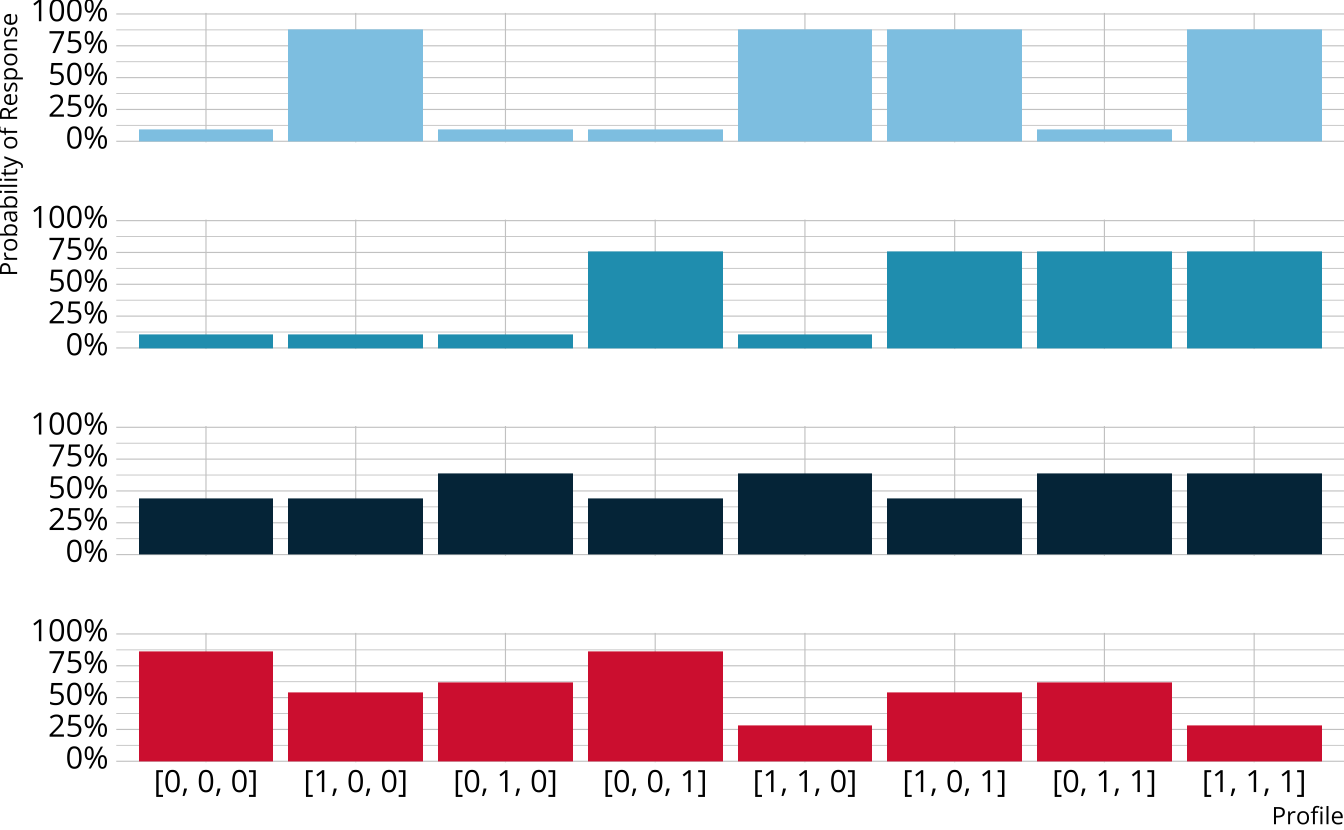
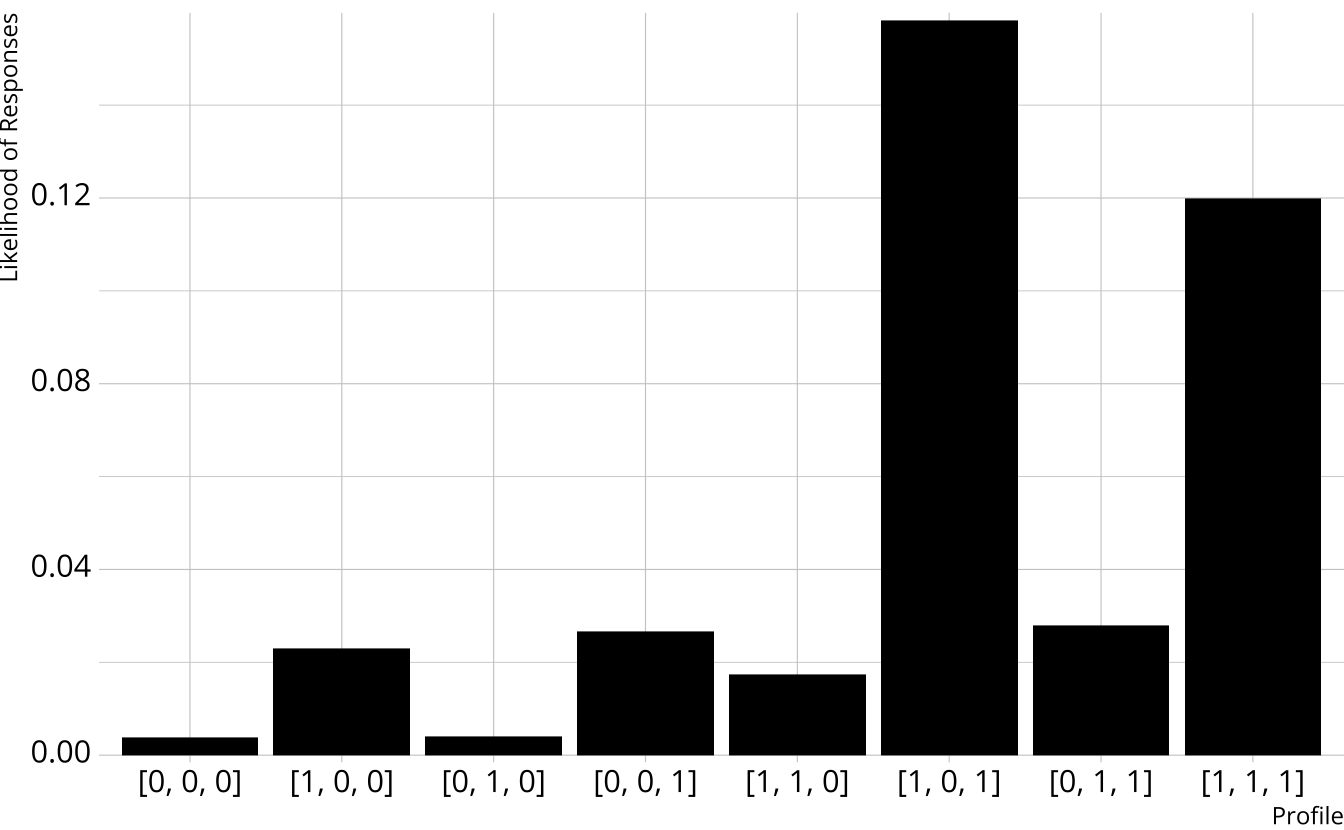
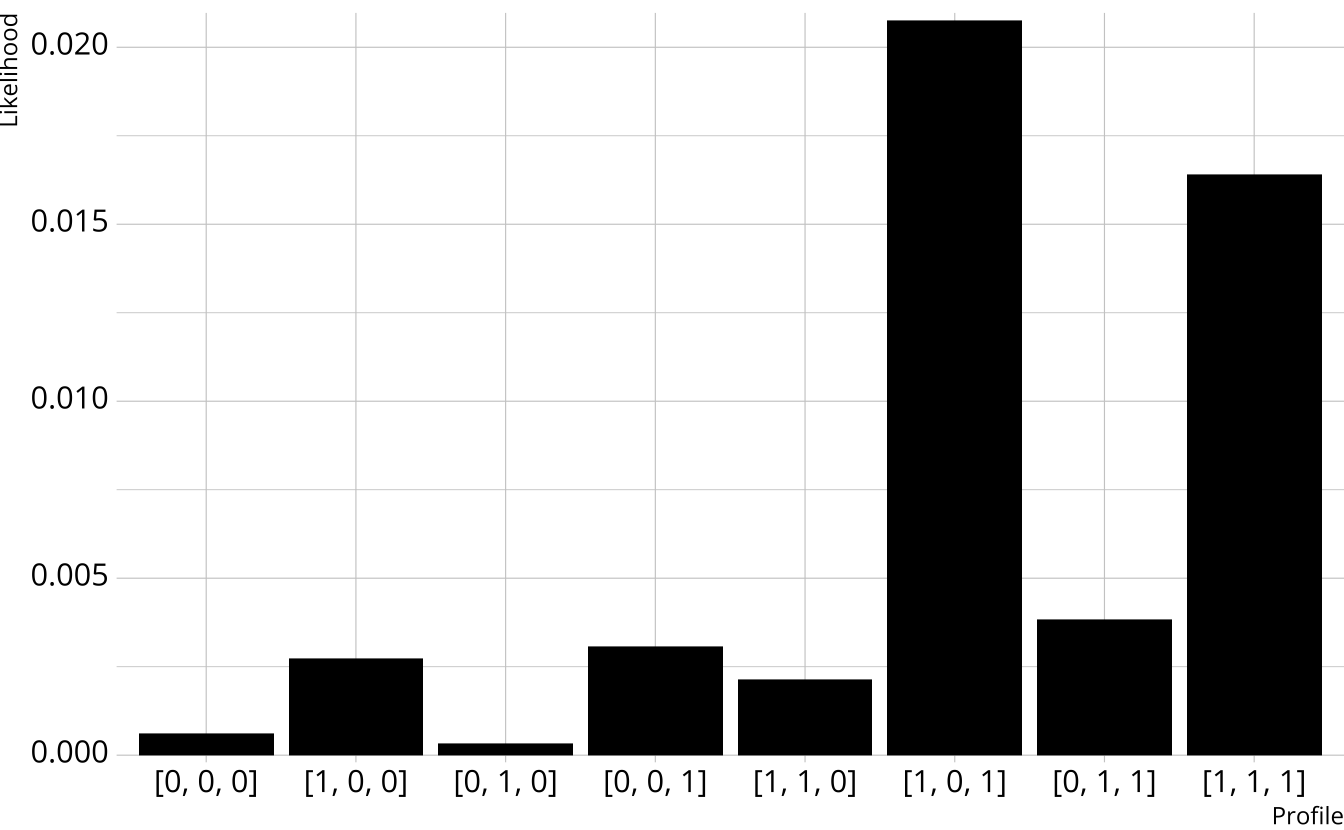
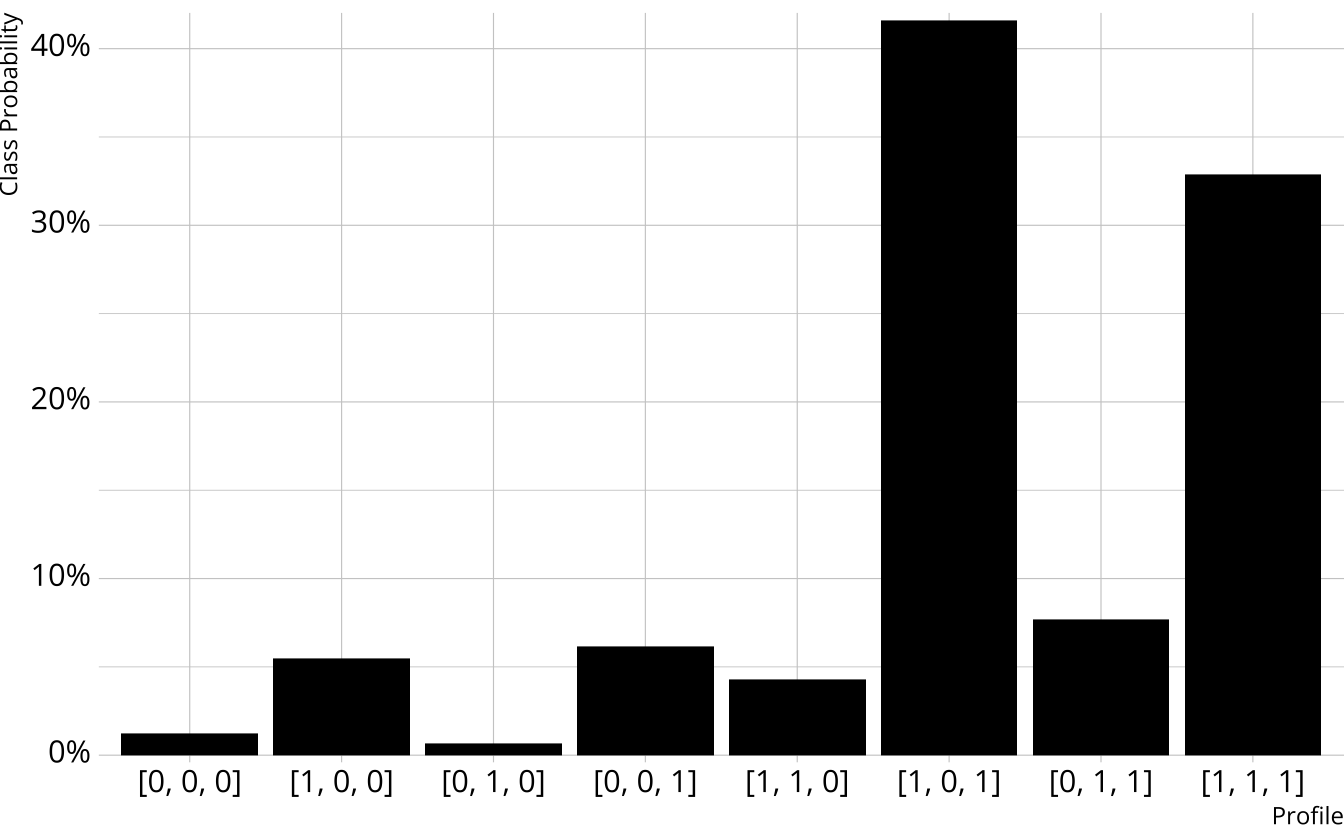
DCM respondent estimate
- Multiply the response probabilities together for each class
- Multiply the item response likelihoods by structural parameters
- Class probabilities are the class likelihoods divided by the total likelihood
From class to attribute probabilities
- For each attribute, sum the class probabilities where that attribute is present
Songwriting: 84.3%
Production: 45.3%
Vocals: 88.2%
| songwriting | production | vocals | probability |
|---|---|---|---|
| 0 | 0 | 0 | 0.012 |
| 1 | 0 | 0 | 0.055 |
| 0 | 1 | 0 | 0.007 |
| 0 | 0 | 1 | 0.062 |
| 1 | 1 | 0 | 0.043 |
| 1 | 0 | 1 | 0.416 |
| 0 | 1 | 1 | 0.077 |
| 1 | 1 | 1 | 0.329 |
| 0.842 |
| songwriting | production | vocals | probability |
|---|---|---|---|
| 0 | 0 | 0 | 0.012 |
| 1 | 0 | 0 | 0.055 |
| 0 | 1 | 0 | 0.007 |
| 0 | 0 | 1 | 0.062 |
| 1 | 1 | 0 | 0.043 |
| 1 | 0 | 1 | 0.416 |
| 0 | 1 | 1 | 0.077 |
| 1 | 1 | 1 | 0.329 |
| 0.455 |
| songwriting | production | vocals | probability |
|---|---|---|---|
| 0 | 0 | 0 | 0.012 |
| 1 | 0 | 0 | 0.055 |
| 0 | 1 | 0 | 0.007 |
| 0 | 0 | 1 | 0.062 |
| 1 | 1 | 0 | 0.043 |
| 1 | 0 | 1 | 0.416 |
| 0 | 1 | 1 | 0.077 |
| 1 | 1 | 1 | 0.329 |
| 0.884 |
The rest of today
Diagnostic classification models
A brief introduction